Spring 2002
Review 4: selected solutions
- In the ABC corporation, the salaries are as follows:
- 100 people earn $20,000 per year
- 20 people earn $40,000 per year
- 2 people earn $100,000 per year
- 1 person earns $1,000,000 per year
- Determine the mean salary and the median salary
Solution: The median is $20,000, while the mean is $4,000,000/123 = $32520.33.
- Which of these two central measures is more representative of the "typical
worker's" salary? Please comment.
A suggestion:The vast majority of people in this company earn $20,000 each.
But the mean is more than 50% higher than what each of these people earns. . . .
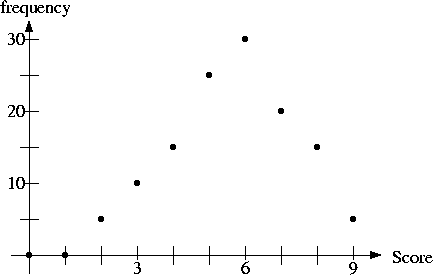
- On a test , where the possible score were from 1 to 9, the following numbers of people received each score:
- Find the median, mean and standard deviation.
Solution: There are 125 students. The sum of the scores is 710. (Remember to multiply each score by its frequency.)
Dividing by the number of students (125), we that the mean is 5.68.
The median is 6.
To calculate the standard deviation, use formula (11.9). Thus, the sum of the squares is 4,400,
so that the average of the squares is 35.2. The formula says that
s2 is the "average of the squares" minus the "square of the average", or:
s2 = 35.2 - (5.68)2 = 2.9376.Therefore s = 1.714.
- Plot the frequency as a function of the score.
It's OK just to make dots, similarly to Figure 11.1 in the text.
(Of course, it will be scaled differently . . . )
Solution:
- . . .
- A fair coin is flipped 100 times.
- Determine the expected number of heads.
Solution: We have p= .5, so the expected number is .5·100 = 50. - Determine the standard deviation for this experiment.
Solution: By formula (11.10), it is =
=
 = 5
= 5 - Find the probability that the number of heads will be:
- 60 or greater
Solution: Since the mean is 50 and the standard deviation is 5, we calculate:
(60 - 50) / s = 10 / 5 = 2. Thus, 60 is 2 standard deviation units above the mean, so we have z = 2.
We look in Table 11.5 and find A(2) = .477.
Since we're looking for the right-hand tail, we have p = .5 - .477 = .023.
So, there's a 2.3% chance of getting 60 or more heads. - 45 or fewer
Solution: This time, 45 is 1 standard deviation unit below the mean. We look in the table and find A(1) = .34.
Again, we're looking for the tail, so p = .5 - .34 = .16. - between 45 and 55 (inclusive)
Solution: Here, we need to find the area under the curve between z = 1 and z = -1.
Since the curve is symmetric, this is 2·A(1) = .68.
- 60 or greater
- Determine the expected number of heads.
- The scores of students on a standardized test are normally distributed,
with a maximum possible score of 1000, a mean of 700 and a standard deviation
of 90.
Find the z-values and the actual scores corresponding to each of the
following:
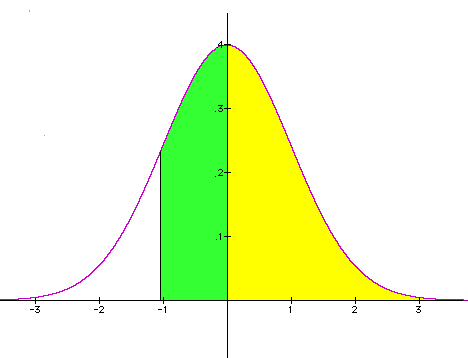
- The score above which 85% of the scores are situated.
Solution: We look in the table for the value of z with A(z) = .85 - .5 = .35. So, z = 1.0. [Perhaps z = 1.05 would be more accurate.]
The corresponding score is 700 - zs = 700 - 1·90 = 610. [or 700 - 1.05·90 = 605]
To see how we did the first step, note that in the figure the yellow area = .5 {half of the area under the normal curve},
so that the green area must be .85 - .5 = .35.
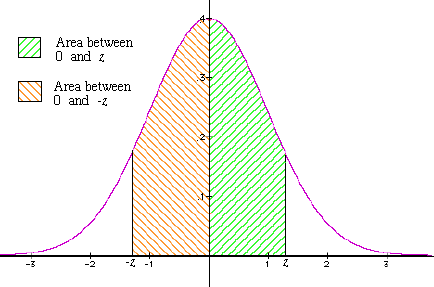
- The score below which 95% of the scores are situated.
Solution: We look for the value of z with A(z) = .95 - .5 = .45. So, z = 1.5.
The corresponding score is 700 + zs = 700 + 1.5·90 = 835.
(The situation in the figure is reversed: this time we use the fact that the left half of the curve has area = .5.)
- The z-value such that 80% of the normal curve lies within z standard deviation units of the mean, and the actual scores (at equal distance and opposite directions from the mean) such that 80% of the students have scores between these two scores.
Solution: We need to have A(z) = .8 / 2 = .4. So, z = 1.3, again from the table. The actual scores are thus between 700 - zs = 700 - 1.3·90 = 583 and 700 + zs = 700 + 1.3·90 = 817. (In this figure, each of the shaded regions
must have half of the desired area.)
- The score above which 85% of the scores are situated.
- Calculate the following:
 12 + 22 + 32 + 42 =
1 + 4 + 9 + 16 = 30.
12 + 22 + 32 + 42 =
1 + 4 + 9 + 16 = 30.
 1 + 3 + 5 + 7 + 9 + 11 = 36.
 -12 + 22 -32 +42 =
-1 + 4 - 9 + 16 = 10.
-12 + 22 -32 +42 =
-1 + 4 - 9 + 16 = 10.
 =
1/(2-1)
- 1/(3-1)
+ 1/(4-1)
- 1/(5-1) =
1 - 1/2 + 1/3
- 1/4 = 7/12.
=
1/(2-1)
- 1/(3-1)
+ 1/(4-1)
- 1/(5-1) =
1 - 1/2 + 1/3
- 1/4 = 7/12.
- A car worth $15,000 is the first prize in a raffle, along with 2 second
prizes worth $500 each and 10 third prizes worth $75 each.
A ticket costs $2, and 20,000 tickets are sold. The tickets are thoroughly mixed, so that all tickets are equally likely to be drawn.
Winning tickets are removed from the drawing for further prizes.
Determine the expected net winnings of a person who buys 1 ticket.
Solution: We start by making a table of the outcomes, with their probabilities and net outcomes. (In each winning outcome, we subtract the ticket price of $2.
p payoff wins car .00005 $14,998 2nd prize .0001 $498 3rd prize .0005 $73 wins nothing .99935 - $2
To calculate the expectation, we multiply each payoff amount by its probability and then add:
E = .00005·14,998 + .0001·498 + .0005·73 - .99935·(-2)
= .7499 + .0498 + .0365 - 1.9987
= - 1.1625.
So, on the average, each participant will lose about $1.16. But presumably the raffle is being done to raise money for a worthy cause . . .
- Review the class exercises and homework problems.
Click here to see solutions to some of the chapter 11 exercises (mainly from §11.5).
|
Score |
0 |
1 |
2 |
3 |
4 |
5 |
6 |
7 |
8 |
9 |
|
frequency |
0 |
0 |
5 |
10 |
15 |
25 |
30 |
20 |
15 |
5 |